Summary of the 2002 Survey of Croquet Players
 Contents...
by Kevin Carter, April 2002
Profundus Consulting Ltd. Tel: +44(0)118-971-2948; email info#profundus.com
©2002 The Croquet Association. All rights reserved. No part of this publication may be copied in full or in part without the prior written consent of The Croquet Association
This page is the summary section from the full survey report, available as a PDF download [305kB]. The 2002 survey data was refreshed by the 2007 survey.
Summary
The CA Marketing Committee was planning a number of projects where an improved understanding of croquet players was important. It was decided to undertake a wide-ranging survey, with the following objectives:
- To enable the Marketing Committee to better "package" croquet to appeal to providers of funding (notably Sport England), sponsors, media and potential providers of benefits.
- To help it to generate more effective recruitment aids for clubs.
- To help understand the profile of CA Associate members vs. non-members.
- To provide the foundation for further marketing initiatives.
The study was conducted by Profundus Consulting Ltd. A mailed questionnaire, with a "Freepost" return mechanism, was chosen as being most appropriate and cost-effective. It was sent to 1300 Associates (from the CA database) and 950 non-Associates (supplied by club secretaries of 38 clubs).
The targeted response rate was 20%, but this was comfortably exceeded, as a surprising 1020 (45%) responses were received. There was overwhelming support for the aims of the survey and the way in which it was conducted. There was also a good fit geographically in terms of survey responses (on the right in the table below) and CA statistics (on the left).
| CA Federations | Associates | non-Associates | Survey regions | Associates | non-Associates | |
|---|---|---|---|---|---|---|
| London & SE | 32% | 28% | London + SE | 36% | 38% | |
| Southern | 7% | 10% | South Central | 9% | 9% | |
| South West | 24% | 25% | SW + West + Wales | 24% | 25% | |
| East Anglia | 12% | 8% | East Anglia | 9% | 9% | |
| East Midlands + West Midlands | 9% | 11% | Midlands | 11% | 10% | |
| North West | 9% | 10% | North West | 6% | 5% | |
| North + Yorkshire | 7% | 7% | North East | 5% | 2% |
The total cost of the survey was £937, most of which were the expenses associates with printing, mailing and Freepost.
Analysis of the data was undertaken in a three-stage process:
- "Primary" analysis, in which the responses to each question are considered in turn, with graphical representations and certain interpretive comments.
- "Secondary" analysis, in which some questions are considered together, to obtain cross-tabulations and to observe interesting correlations.
- "Tertiary" analysis, which is less scientific and more an art, to build profiles or stereotypes of observed groups of players.
The Most Interesting and Useful Issues Emerging From the Primary Analysis Were
- Two thirds of croquet players are male, with an age distribution as shown in the chart.
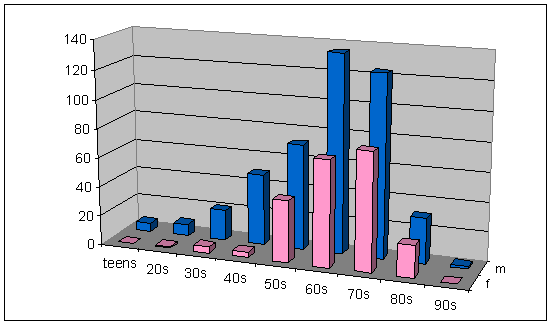
With over 60% aged above 60 this justifies the stereotype that croquet is suitable for more active OAPs. It is especially notable that few women play before they reach their 50s.
- 48% of respondents are graduates (Associates 53%, non-Associates 37%).
- 71% of all croquet players are retired. 41% are, or were, qualified professionals and 25% in management.
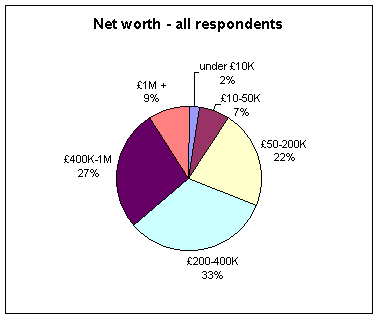
- Croquet players are affluent, with well above average incomes and net worth. Indeed, 47 millionaires responded.
- The fourth most read newspaper or magazine (after the Daily Telegraph, Sunday Telegraph and Times) was Saga.
- With computer ownership at 70% and email usage at 60%, croquet players are well above the national averages. Three-quarters of all those who surf the web look at the CA website at least occasionally.
- 51% of respondents had played croquet "in the garden", and 43% of these first did so before they were 20. This supports the widely held belief that interest in croquet is kindled at an early age by playing in the garden.
- Half of all players are introduced to association croquet at the same time as golf. Of the remainder, 31% played association first. Only in the past four years have more taken up golf than association.
- 28 respondents came from the 150 players recorded by the CA as having no club. The remainder, on average first belonged to a club 10.9 years ago.
- When asked what other people players had introduced to croquet the analysis shows:
spouse/ptnr children relations friends workmates others 203 29% 160 23% 104 15% 433 62% 90 13% 124 18% This is a very significant result and amply demonstrates croquet's best recruitment aid: people who are already playing persuading others to take up the sport.
- Another important finding was that the single greatest factor influencing players to take up croquet is the availability of a local club. The majority of respondents cited this as a reason, and as the single greatest influence it scored twice as highly as any other factor.
- When an emphasis is put upon reasons for continuing, rather than taking up, croquet, we see a shift. While having a local club remains important, it is less so - presumably once "hooked", players are more prepared to travel.
Now it is the "soft" influences that come to the fore, particularly croquet's appeal to the competitive instinct and the desire to improve. Interestingly, too, "fresh air and exercise" becomes much more important - certainly with many older players croquet will have become the principal opportunity to enjoy an outdoor activity.
- 7% had never received any coaching. For those that had, club coaching dominates, with 88% of all those who had received any coaching having received all or some of it at the local club. The proportion that have been through a CA coaching course is now getting quite high, at 28%.
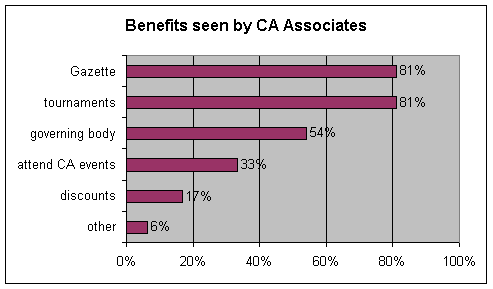
- Respondents who were CA Associates were asked what they see as the benefits of their subscriptions.
As the chart shows, receiving The Croquet Gazette and being able to play in CA tournaments were highest. However, the altruistic "contributing to the running of croquet's governing body" was also cited by over a half.
A similar question was put to non-Associates. While the proportions were similar, the overall levels were far lower (e.g. Gazette 28%), justifying their decision not to subscribe.
- Walking/rambling and gardening are the most popular other activities of croquet players. The most popular sports and pastimes given up before croquet was taken up were the racquet sports: tennis, squash and badminton.
- 57% of croquet players believe they are more healthy and fit relative to others of the same age, and 54% think that croquet contributes to this. Similarly 74% believe their mental agility is above the norm and 63% are confident that croquet helps.
- 10% had suffered from a cardio-vascular disease and 15% currently have other disabilities. These are figures which could prove very useful in justifying croquet to grants bodies.
The Secondary Analysis Considers Several Responses Together to Answer Certain Questions
What Makes a Good Player?
Here we chose to define "good" as having a handicap below four.
The analysis confirmed what is widely known: young men are best at croquet. Also, there is a very high correlation between a competitive instinct and performance. There is also a significant correlation between playing, or having played, snooker/billiards/pool and croquet performance.
Other factors which might have shown a high correlation, but did not, include:
- being a university graduate;
- having first played in the garden;
- regarding croquet as an intellectual challenge;
- having been coached.
Why are Men Better at Croquet than Women?
The extent of the problem was measured:
- while 34% of respondents were women, less than 9% with a handicap of four or less were female;
- males dominate the rankings - for instance only 19 of the UK"s top 200 players are female;
- though not quite as pronounced, the imbalance is the same elsewhere in the world.
The first, and possibly main, reason of why males are so much better at the sport than females is explained by the fact that only 4% of female players are aged below 50, while the comparable figure for males is 19%. We know that age is a prime determinant of a "good player" so it follows that, with fewer young females, there will be fewer good players.
So, maybe the question should be, not "Why are men better at croquet than women?", but more "Why don't more women take up croquet earlier?". Looking at the influences on taking up croquet and on continuing to play the sport, there is a consistent pattern of males playing for the intellectual challenge, to satisfy a competitive instinct, etc., while women play more for fresh air, sociability, to meet interesting people, etc.
Empirical evidence was sought, and amply obtained, from Oxford University Croquet Club, from a schools coaching coordinator and others that it is the fundamental stereotypical differences between males and females, in terms of competitiveness and expectations, that leads to the imbalance.
How Can the Number of CA Associates be Increased?
Clearly, the better players who wish to participate in CA tournaments have to be Associates. The question therefore becomes: why, except for tournament players, do otherwise equivalent people either choose to subscribe or not.
We examined a number of factors, such as age and income, but there is no clear-cut profile of a CA Associate. The single factor appears to be that some players considers there to be sufficient benefits in becoming a CA Associate; others do not. The simple answer is to increase the benefits in order to get more members.
The Tertiary Analysis Builds Profiles or Stereotypes of Observed Groups of Players
We have defined four distinct profiles of croquet players. The numbers are summarised in the following table:
| Characteristics | CA Associates | Non-Associates | All Croquet Players | |
|---|---|---|---|---|
| Stars | low handicap (<4) or potentially low handicap and < 40yo |
24% | 0% | 10% |
| Busy Hobbyists | handicap <=16 and not retired | 12% | 13% | 13% |
| Novices | handicap >16 or no handicap, and been playing for up to 3 years | 9% | 31% | 22% |
| Retirees | retired and over 60yo, and been playing for more than 3 years | 51% | 45% | 48% |
| (N.B. slight overlap between Stars and Retirees) | 94% | 89% | 93% |
| Stars | Players who have mastered croquet. they perform to a high standard, they read books, they discuss tactics. Most are male. All are Associates. There are three subgroups within the Stars group: | ||||
| Tigers | Top class players, mostly young and very competitive; | ||||
| Young Turks | Fairly young players with the potential to become "Tigers"; | ||||
BTDIGTTs |
Been there, done it, got the tee-shirt - ex-Tigers and Turks who don't make it; they now play more for fun; many are past the prime of their lives, as well as their croquet. | ||||
| Busy Hobbyists | Competent players, but are below Star quality; they regard croquet as an enjoyable hobby; they are working people and mostly male. | ||||
| Novices | Players who are fairly new to the game and who still have a high handicap. This group represents 22% of all croquet players and it is divided fairly equally between men and women. Some of this group will decide croquet is not for them and they will drop out. | ||||
| Retirees | The largest group numerically. We have two subgroups:
Though fitter than the average for their age, a high proportion of retirees enjoy their croquet despite disabilities. They like to help run clubs. |
There are some significant differences in the behaviour of these four groups. However, it tends to relate to croquet factors, such as helping to run croquet, rather than the "lifestyle" factors covered in the survey. Indeed, there are hardly any significant variations in "lifestyle" between any of the groups of croquet players measured; they seem very homogeneous in their outlook.
Introduction
Background
The CA Marketing Committee was developing an idea to negotiate a "package of benefits" for members. This would further enhance the benefits of becoming an Associate. In order to do this it needed to be better able to describe the typical profile(s) of croquet players - for instance, high spenders on telephone calls, hence a "calling card" might be introduced, or, in the (highly unlikely) event that many of them enjoy a drink, then another benefit might be a half-price introductory case from a wine club.
However, once this idea of a "lifestyle"-type survey was mooted it was immediately apparent that this would also be valuable for a wide range of other initiatives. For instance, advice from a sports consultancy was that to be successful in attracting sponsorship sports had to properly "package" themselves. Also, Sport England, when considering grant applications, required more information about croquet players than was readily available
The project was managed by Kevin Carter, whose company Profundus Consulting Ltd., has considerable experience of organising customer surveys, all be it in the field of telecoms and IT. Advice and support was provided by other members of the Marketing Committee, by Quiller Barrett and by his friend Michael Bird, a further research professional who had experience of organising surveys within a sports association. Considerable assistance, in many ways, was also provided by Nigel Graves, the extremely able and amiable CA Secretary.
The author of this report is Kevin Carter, any subjective views expressed within it are his and they do not necessarily represent the views of either the CA as a whole or the CA Marketing Committee.
Objectives
After discussion the following objectives were agreed:
- To enable the Marketing Committee to better "package" croquet to appeal to:
- potential providers of benefits;
- potential sponsors;
- potential providers of funding (e.g. "Sport England")
- media.
- To help it to generate more effective recruitment aids for clubs
- by targeting the type of people most likely try the game, enjoy it, then go on to join a club.
- To help understand the profile of CA Associate Members vs. non-members
- in order that marketing of CA membership can be better targeted, and hence membership increased.
- To provide the foundation for further marketing initiatives
- e.g. if a target group displays great enthusiasm for croquet but is numerically under-represented.
With the benefit of hindsight, a further advantage of undertaking the survey can now be seen. Particularly among non-Associates, the survey has raised awareness of croquet - for instance the many different types of play (some had never heard of advanced level) and the wide variety of reasons why people might enjoy the game - and of the CA, especially the benefits accruing from Associate membership.
Methodology
A mailed questionnaire was considered appropriate.
A quantitative approach was necessary, since some statistical significance to the responses was needed. Qualitative approaches, such as focus groups, provide no more than "colour".
In the ideal world a telephone survey would probably have been best, but the cost for this would be beyond the means of the CA.
A mailed questionnaire is far less expensive and is equally valid. Its disadvantages are:
- uncertainty over the level of response;
- the questionnaire must be simpler and there is less flexibility for routing and open questions;
- it needs greater time to complete the project.
The questionnaire had to be thoroughly tested prior to its serious use.
It was agreed that the sample should be randomly selected and should comprise two categories:
- people who are already CA Associate members;
- people who are members of an affiliated club but with no individual CA membership ("non-Associates").
(A possible third categories - players who are neither - was considered too difficult to address to address, and in any case the benefits of so doing are slight).
To achieve a reasonable statistical significance it was recommended that we should look for a response of at least 200 from each category (which, in statistical terms, yields a worst case "standard error" of 7.1%). We believed that we should hope for a response rate of about one in five, so a minimum sample of 1000 in each category needed to be mailed.
There are two classic ways of improving response rates:
- to include a reply-paid envelope or Freepost;
- to offer an incentive.
Including a stamped addressed envelope with each questionnaire mailed is the best of all response mechanisms, but is very expensive. However, a "Freepost" licence costs just £60 (for the minimum period of a year) and each reply through it is charged at 19p. So, 400 replies would cost £138 in total, and this was considered good value.
On the face of it, an incentive would be easy to organise in an affordable manner - for instance a prize draw for some books from the CA shop's book store. However, guaranteeing anonymity was essential and an incentive cannot be organised - at least not very easily - without asking for a name.
Data processing would be time-consuming but not especially difficult. Analysis would be on a question-by-question basis, along with noting some simple correlations and cross-tabulations. However, this phase would then be followed by some creative interpretation to generate "profiles". The results were to be presented as a report - this report.
The CA Management and Marketing committees decided that the findings (or at least the relevant and positive ones) should be widely disseminated, both in detail to other committees and to members through a summary in The Croquet Gazette.
The Sample
Rather than randomly sample 1000 Associates from the complete list of about 1600, we had the opportunity to share the Fixture Book mail-out in mid-January. This saved both effort and cost.
The non-Associates mailing was rather more tricky. First, a letter was sent out to the secretaries of all CA-affiliated clubs asking for lists of their non-Associates. From the 119 clubs, lists were obtained from 38. A further seven offered to help by mailing-on the questionnaires to their members, without releasing lists to us, two totally refused and the request was ignored by the remainder.
Many of the lists received made no distinction between Associates and non-Associates, so these divisions were made by the CA Secretary with reference to the members" database. Nine lists were on computer files, two in the form of mailing labels and the other 27 were printed or hand-written. This left us with 650 addresses to copy by hand onto envelopes, which was undertaken by two willing teenagers over a very boring weekend.
The final numbers of questionnaires mailed were:
- Associates: 1300 (i.e. omitting all who had not paid their 2002 membership and a second questionnaire to two-member households)
- Non-Associates: 950
The Questionnaire
The questionnaire was drafted, in December 2001, in accordance with the objectives, then circulated to the Marketing Committee for comments and suggestions. Needless to say, it underwent substantial revision. However, it was agreed that its length should be no greater than five sides of A4, so several suggestions for additions had to be rejected. The design of the questionnaire also included certain features to facilitate data input and analysis.
Over Christmas it was tested informally and several questions were revised to make them "work" better. Also, the presentation was completely revised.
A "live" trial, was organised in early January, when the questionnaire was circulated to twenty Surbiton members, along with a "questionnaire on the questionnaire". This went very well and only a little further tweaking was necessary before it went to the printers.
Summary of Responses
Our fears of an inadequate response were unfounded - it was unprecedented in size. At the time, in mid-February, that data input was terminated over 700 had replied, they continued to come in and at the time of preparing this report, in mid-March, 1021 responses had been received and they were still trickling in.
It might be worth briefly pondering why the response was so good. This was not an easy questionnaire to complete; it took most people 15-20 minutes and it pried into some very sensitive areas. However, feedback we received suggested that:
- respondents felt a need to support the CA"s efforts to facilitate grants and other initiatives;
- the Freepost arrangement removed any feeling that it cost them anything (at least anything more than their time);
- respondents enjoyed completing the questionnaire (many said so!).
Of the 708 input and analysed, 69% were from associates and 31% from non-Associates. If these rates were continued for the full total then the response rates from Associates was 53% and from non-Associates 33%.
There was concern, too, that we had a representative geographic spread. In order to measure our response against the "universe", we obtained from the CA Secretary an analysis of Associates and non-Associates, by Federation, from the CA database. This is reproduced in Appendix B.
The normal geographic areas in our questionnaire do not correspond exactly with CA Federations. Also, the "no club" category was omitted from our survey.
Given these constraints, and the need for normalisation, the following table shows a summary of the universe vs. our responses:
| CA Federations | Associates | non-Associates | Survey regions | Associates | non-Associates | |
|---|---|---|---|---|---|---|
| London & SE | 32% | 28% | London + SE | 36% | 38% | |
| Southern | 7% | 10% | South Central | 9% | 9% | |
| South West | 24% | 25% | SW + West + Wales | 24% | 25% | |
| East Anglia | 12% | 8% | East Anglia | 9% | 9% | |
| East Midlands + West Midlands | 9% | 11% | Midlands | 11% | 10% | |
| North West | 9% | 10% | North West | 6% | 5% | |
| North + Yorkshire | 7% | 7% | North East | 5% | 2% |
In other words, the "fit" is very good - there is no significant bias in responses.
Data Input and Analysis
Responds were input into a (very large) Excel spreadsheet.
By means of a variety of techniques - notably sorting and filtering - responses against each question were counted and classified. Where appropriate the raw data was represented graphically using standard Excel charts.
The results of the analysis are presented in section 3 below.
Budget and Costs
The CA Management Committee agreed a budget of £1000 to undertake the survey. With no manpower costs for design, fulfilment, data input and analysis this was all available for expenses, which comprised:
Printing of questionnaires £390 + VAT
1000 2nd-class stamps (for the non-Associates mailing) £190
1000 envelopes and labels £23 + VAT
Paid help to prepare non-Associates mailing £75
Freepost licence £60
Freepost payment for postage on replies (1020) £ 199
Total £937
(VAT was recovered by the CA)
 Using this website

